Difference between revisions of "Instrumentation"
| Line 20: | Line 20: | ||
*Making plots in Python | *Making plots in Python | ||
| − | The students are taken through each section with example codes which they are supposed to run. At the end of the exercise, students are given some tasks in these areas to undertake and present their findings. The complete manual for this lab is available at [[Media: | + | The students are taken through each section with example codes which they are supposed to run. At the end of the exercise, students are given some tasks in these areas to undertake and present their findings. The complete manual for this lab is available at [[Media:Instrumentation Lab1.pdf|Instrumentation Lab1.pdf]] |
| Line 27: | Line 27: | ||
<span style="font-size:larger">'''Analog to Digital Conversion'''</span> | <span style="font-size:larger">'''Analog to Digital Conversion'''</span> | ||
| − | <p style="text-align: justify">Most of signals from | + | <p style="text-align: justify">Most of signals from sensors are analogue in form. Raspberry Pi being a microprocessor based systems handles only digital signals. It has no inbuild analogue to digital converter. This necessitates for development of an analogue to digital converter in instrumentation.</p><p style="text-align: justify">MCP3008 analogue to digital converter chip is used in this work. It is a 10 bit, 8 channel IC as shown in the schematic . A variable resistor is used as the source of the analogue signal and is connected to 5 V source. The analogue input (0 to 5 V) is fed to one of the 8 channels of the MCP3008. Other connections to be made are described in the lab manual [[Media:Instrumentation_Lab2.pdf|Analog to Digital Conversion.pdf]] for this lab.</p><p style="text-align: justify">By adjusting the variable resistor, different values of analog voltages are used for testing the converter. The output (digital equivalent in decimal form) is displayed on the monitor</p> |
The setup and sample results for this lab are shown below | The setup and sample results for this lab are shown below | ||
[[File:ADC setup.jpg|x215px|ADC setup]] [[File:Adcresult1.jpg|x215px|ADC sample result 1]] [[File:Adcresult2.jpg|x215px|ADC sample result 2]] | [[File:ADC setup.jpg|x215px|ADC setup]] [[File:Adcresult1.jpg|x215px|ADC sample result 1]] [[File:Adcresult2.jpg|x215px|ADC sample result 2]] | ||
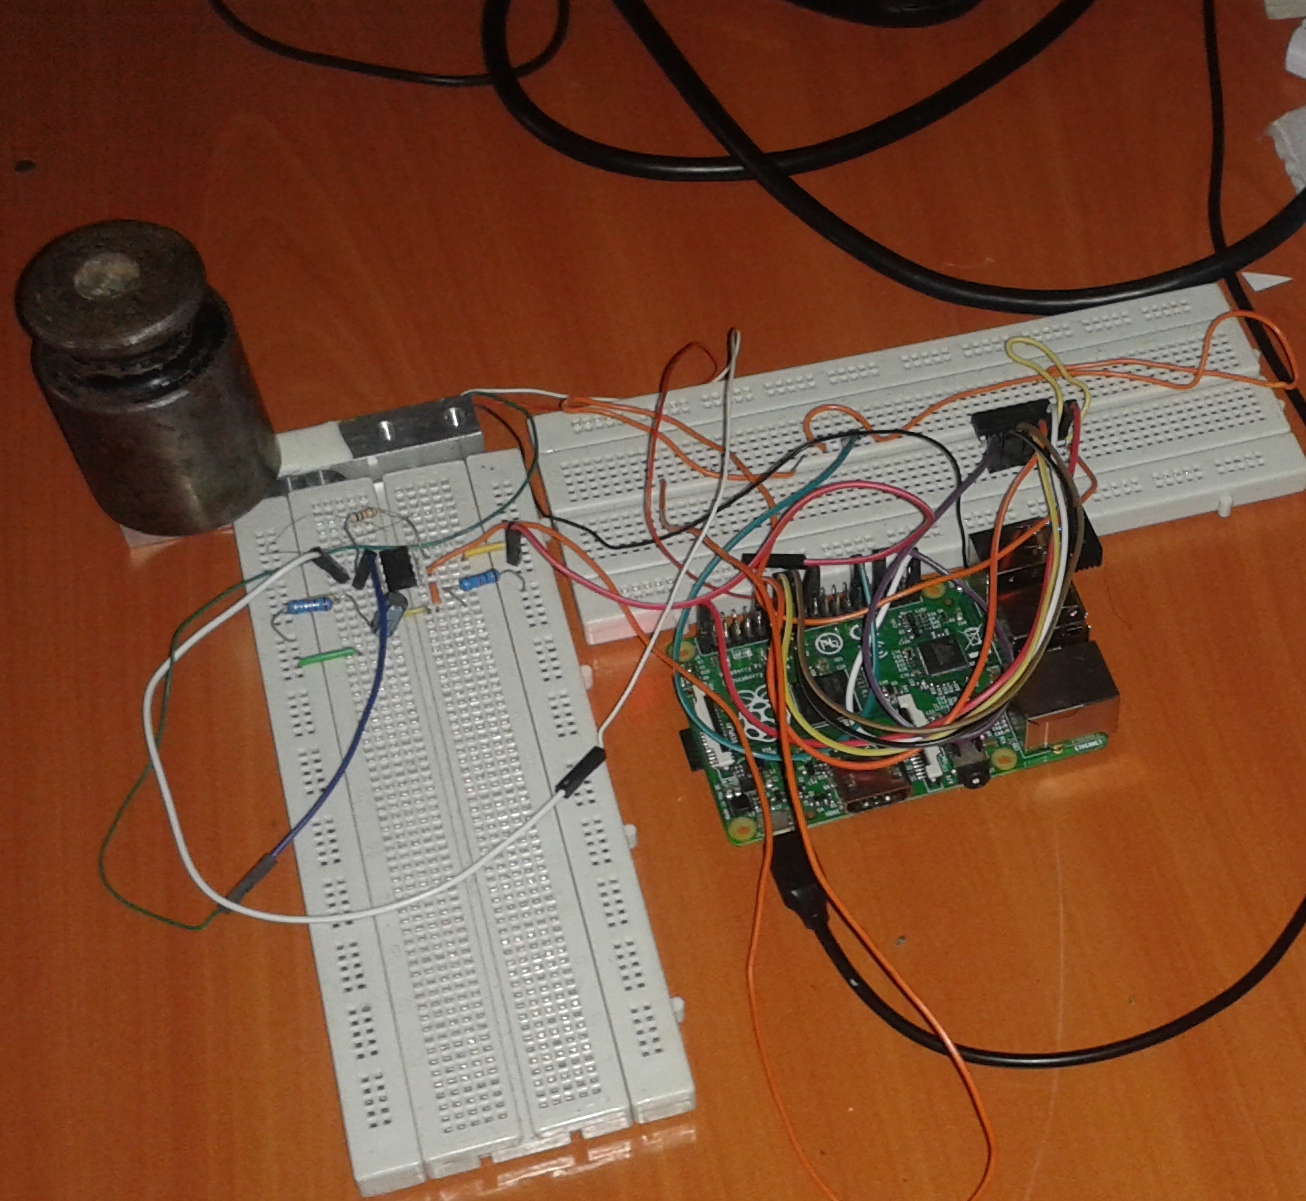
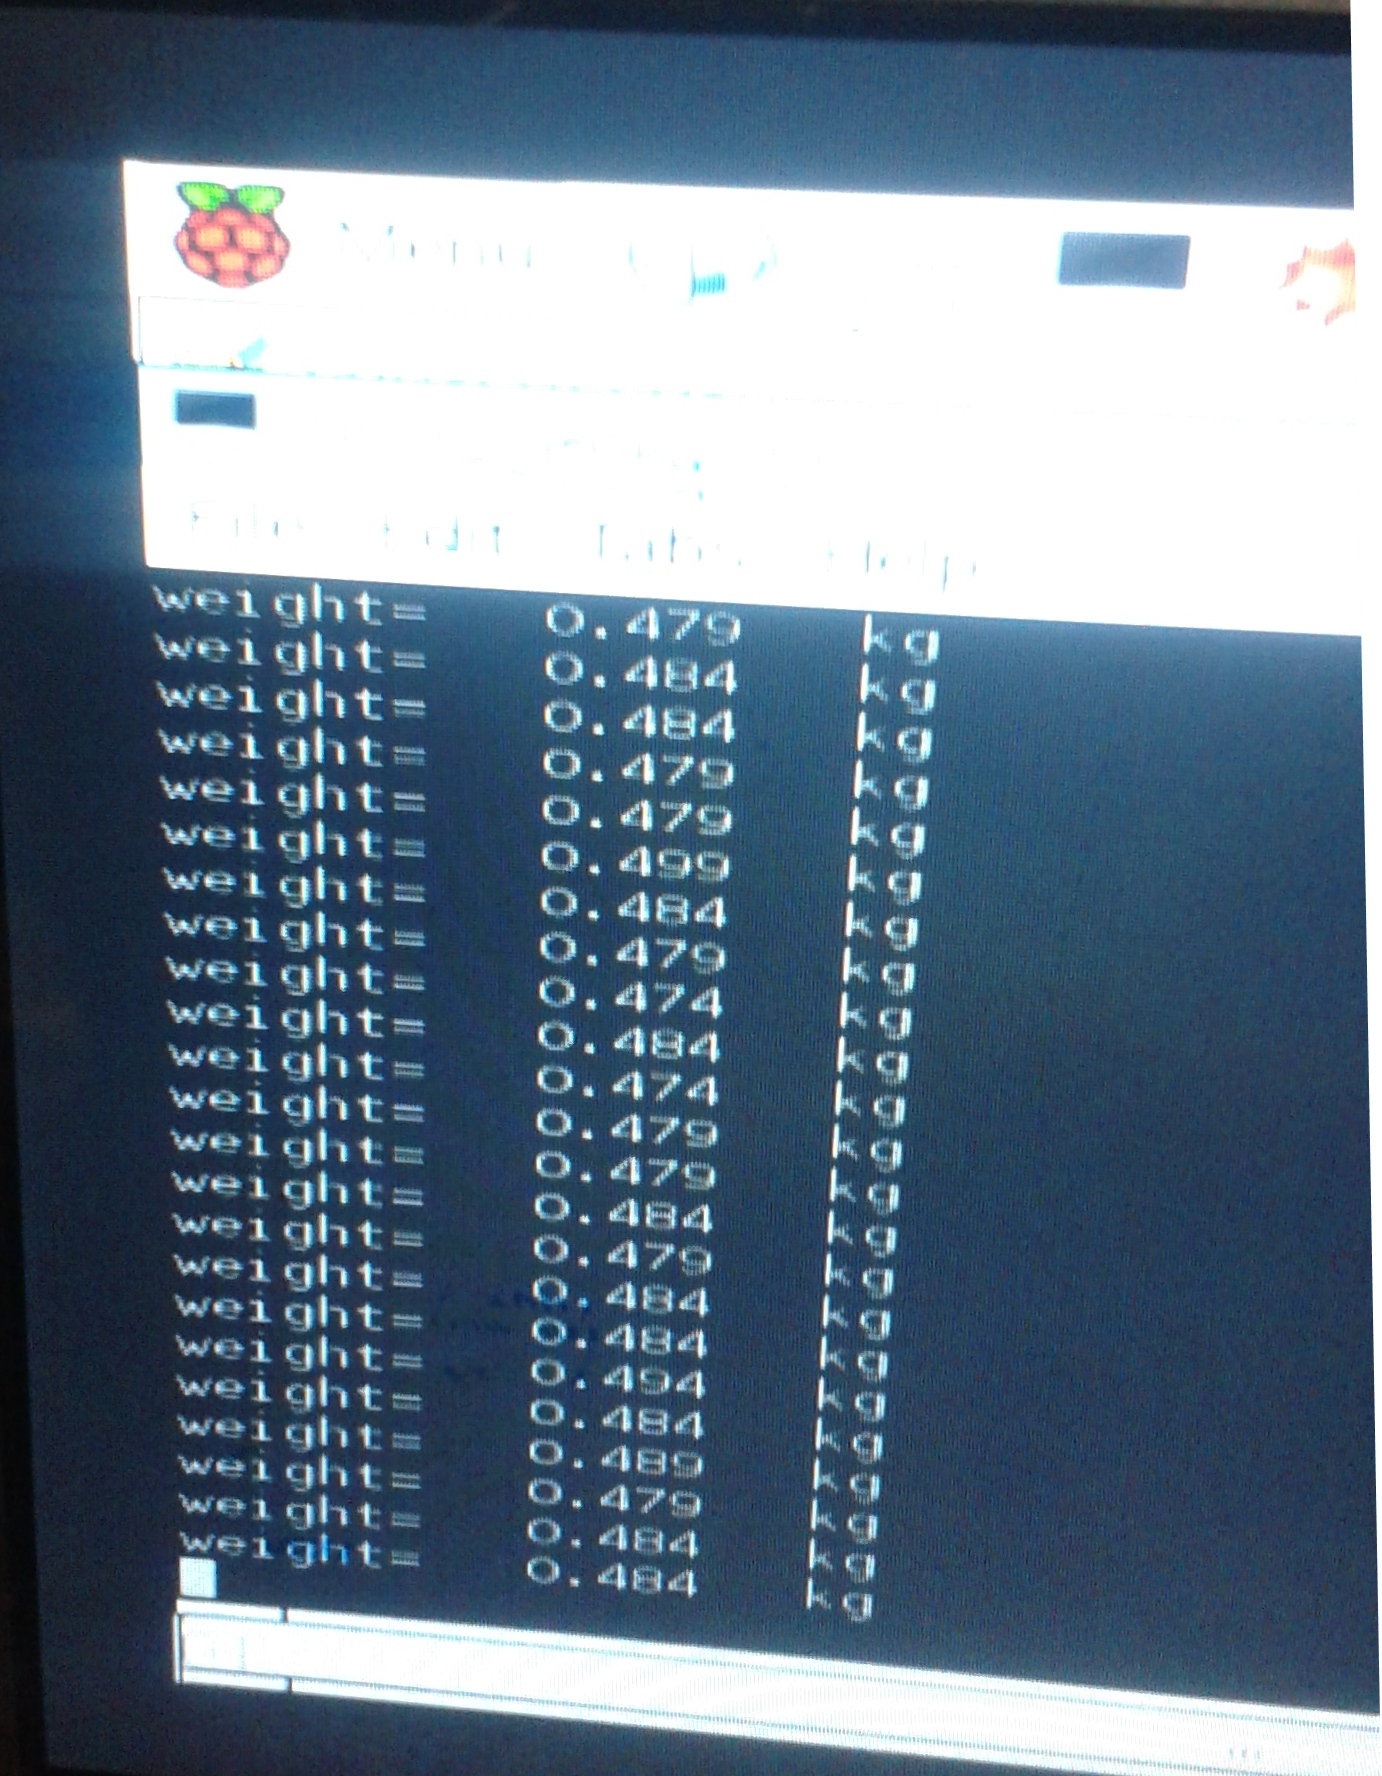
| − | <br/><div><span style="font-size:larger">'''Real-time Remote Force Measurement and Recording'''</span></div><div style="text-align: justify"><span style="font-size:larger"><span style="font-family:times new roman,times,serif">Telemetry is important in instrumentation as it enables collection of data from several measurement points at inconvenient locations or inaccessible areas transmit that data to a convenient location and present the several individual measurements in a usable form.</span></span><br/><br/></div><div style="text-align: justify"><span style="font-size:larger"><span style="font-family:times new roman,times,serif">The stain gauge on the principle that a resistance of a wire of a semiconductor is changed by elongation or compression due to externally applied stress. It is commonly used in the measurement of force , torque and displacement. The output signal of the strain gauge requires amplification and AD620 (operational amplifier) chip has been used for this purpose.</span></span><br/><br/></div><div style="text-align: justify"><span style="font-size:larger"><span style="font-family:times new roman,times,serif">After amplification, the signal is converted to digital form using similar procedure in lab 1 described above. WiFi network is used for transmission of the digital output from the remote location to the central control room. At the receiver side, data is first displayed on the monitor for purpose of real time monitoring. Its later stored in a database developed using mySQL.</span></span><br/><br/></div><div style="text-align: justify"><span style="font-size:larger"><span style="font-family:times new roman,times,serif">The procedure to be used is detailed in the lab manual [[ | + | <br/><div><span style="font-size:larger">'''Real-time Remote Force Measurement and Recording'''</span></div><div style="text-align: justify"><span style="font-size:larger"><span style="font-family:times new roman,times,serif">Telemetry is important in instrumentation as it enables collection of data from several measurement points at inconvenient locations or inaccessible areas transmit that data to a convenient location and present the several individual measurements in a usable form.</span></span><br/><br/></div><div style="text-align: justify"><span style="font-size:larger"><span style="font-family:times new roman,times,serif">The stain gauge on the principle that a resistance of a wire of a semiconductor is changed by elongation or compression due to externally applied stress. It is commonly used in the measurement of force , torque and displacement. The output signal of the strain gauge requires amplification and AD620 (operational amplifier) chip has been used for this purpose.</span></span><br/><br/></div><div style="text-align: justify"><span style="font-size:larger"><span style="font-family:times new roman,times,serif">After amplification, the signal is converted to digital form using similar procedure in lab 1 described above. WiFi network is used for transmission of the digital output from the remote location to the central control room. At the receiver side, data is first displayed on the monitor for purpose of real time monitoring. Its later stored in a database developed using mySQL.</span></span><br/><br/></div><div style="text-align: justify"><span style="font-size:larger"><span style="font-family:times new roman,times,serif">The procedure to be used is detailed in the lab manual [[Media:Instrumentation_Lab3.pdf|Realtime Remote Force Measurement.pdf]] provided for this lab. Two weights (0.5 kg and 0.25 kg) are used for testing the system. The setup and sample results are shown below</span></span><br/><br/></div><br/><br/>[[File:Inst setup.jpg|x215px|Inst setup.jpg]] [[File:Halfkg.jpg|x215px|Half kg weight]] [[File:Halfres.jpg|x215px|Half kg weight results]]<br/><div style="text-align: justify"><br/><br/></div><br/><div><br/><br/></div><br/><div><br/><br/></div><br/><br/><br/><br/><br/><br/><br/><br/><br/><br/><br/> |
Revision as of 19:21, 26 October 2015
Instrumentation
This course is taught in the third year of the electrical engineering curriculum. The course mainly deals with
- Transducers for non-electrical quantities .
- Signal conditioning
- Remote sensing techniques
- Microprocessor applications in instrumentation
- Noise and interference reduction
- Data storage, recording and display systems.
We aimed to develop a laboratory exercise that will introduce equip the students with relevant skills in transducers and their applications, to signal conditioning and remote sensing and data storage.
Three labs are have been development as follows
Introduction to Python Prgramming
The aim of this laboratory practice is to Introduce the student to programming in Python and equip the students with important skills in programming with Python to be used later in proceeding labs. Python is a very high level language. The Raspberry PI was actually developed to run Python as its programming platform, hence the term PI in the name Raspberry PI. The lab explores a bit of programming syntax used in Python. Key areas captured in this lab are
- Entering variables in Python
- Common Arithmetic
- Vectors and Matrices
- Flow Control
- Functions in Python
- Making plots in Python
The students are taken through each section with example codes which they are supposed to run. At the end of the exercise, students are given some tasks in these areas to undertake and present their findings. The complete manual for this lab is available at Instrumentation Lab1.pdf
Analog to Digital Conversion
Most of signals from sensors are analogue in form. Raspberry Pi being a microprocessor based systems handles only digital signals. It has no inbuild analogue to digital converter. This necessitates for development of an analogue to digital converter in instrumentation.
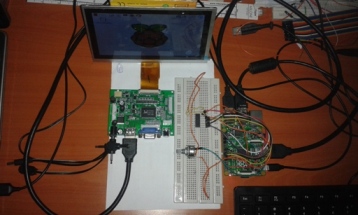
MCP3008 analogue to digital converter chip is used in this work. It is a 10 bit, 8 channel IC as shown in the schematic . A variable resistor is used as the source of the analogue signal and is connected to 5 V source. The analogue input (0 to 5 V) is fed to one of the 8 channels of the MCP3008. Other connections to be made are described in the lab manual Analog to Digital Conversion.pdf for this lab.
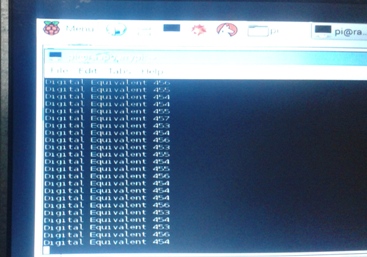
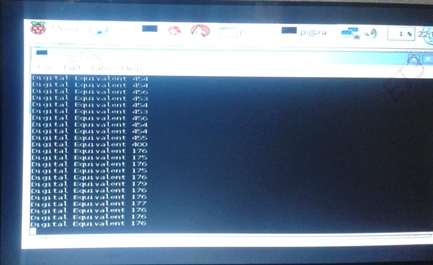
By adjusting the variable resistor, different values of analog voltages are used for testing the converter. The output (digital equivalent in decimal form) is displayed on the monitor
The setup and sample results for this lab are shown below
